Uptime-kuma is a tool for monitoring your various services and sites that you host yourself, distributed under an MIT license. You can find Uptime-kuma’s source code on its GitHub repository, as well as the website of its primary developer: https://louislam.net/.
Uptime-kuma, then, is a free alternative to monitoring tools like Uptime Bot or Status Page that requirement payment.
Uptime-kuma’s main advantage is that it provides several protocols for monitoring your infrastructure and supports several alert systems. As a bonus, it makes it possible to create a status page of your different services, publicly accessible or not, depending on your need and your choice.
How do you install Uptime-kuma on GandiCloud VPS? Here’s a step-by-step tutorial.
Thanks to Benjamin, Gandi hosting support agent, for writing this tutorial.
Uptime-kuma tutorial installation
Prerequisites to Uptime-kuma installation
This tutorial was created using Debian bullseye as operating system and the version 1.17.1 of Uptime-kuma. We’ll also presume that the user already has a Gandi VPS and has already followed the first configuration steps (users, passwords, firewall with ports 22, 80, and 443 open, etc.).
Learn more about the configuration steps
In this example, Uptime-kuma is based on Node.JS, executed with a systemd and npm service, and will be served by nginx. Use Git to obtain the source code.
We should, then, start by installing these four tools first.
- Add a Node.JS repository
$ curl -fsSL https://deb.nodesource.com/setup_17.x | sudo -E bash -
- Install Node.JS, Git, and NGINX
$ sudo apt install -y nodejs git nginx
- Now let’s make sure npm is up to date
$ sudo npm install npm -g
All the pre-requisites are now satisfied, and we can move on to installing Uptime-kuma.
Uptime-kuma installation steps
To limit the security risks, create a standard user that will be dedicated to running Uptime-kuma:
$ sudo adduser --disabled-password uptimekuma
Now run the following commands as uptimekuma:
$ sudo -i -u uptimekuma
To get the tool’s source code, use git, which we previously installed:
$ git clone
https://github.com/louislam/uptime-kuma.git
Now launch the installation from the uptime-kuma repository:
$ cd uptime-kuma$ npm run setup
And verify the npm packet dependencies:
$ npm fund
Uptime-kumais now ready to be run. All you have to do is set up the corresponding systemd service, with the help of sudo.
Quit the uptimekuma user:
$ exit
And implement the service:
$ sudo vim /etc/systemd/system/uptimekuma.service
Add the following content:
[Unit]
Description=Uptime-Kuma - A free and open source uptime monitoring solution
Documentation=https://github.com/louislam/uptime-kuma
<p">After=network.target
[Service]
Type=simple
User=uptimekuma
WorkingDirectory=/home/uptimekuma/uptime-kuma
ExecStart=/usr/bin/npm run start-server
Restart=on-failure
[Install]
WantedBy=multi-user.target
Launch the service:
$ sudo systemctl enable uptimekuma.service --now
Uptime-kuma is now being run and you can make it available on the web with nginx. We presume that you have already generated the necessary certificates, via Gandi’s free TLS / SSL certificate option, for example.
Create the file sub.domain.conf, then, in /etc/nginx/sites-available in order to add the following content:
server {
listen 80;
listen [::]:80;
server_name sud.domain.tld;
location / { return 301 https://$host$request_uri; }
}
server {
listen 443 ssl http2;
listen [::]:443 ssl http2;
server_name sub.domain.tld;
ssl_certificate /path/to/ssl/cert/crt;
ssl_certificate_key /path/to/ssl/key/key;
location / {
proxy_set_header X-Real-IP $remote_addr;
proxy_set_header X-Forwarded-For $proxy_add_x_forwarded_for;
proxy_pass http://localhost:3001/;
proxy_http_version 1.1;
proxy_set_header Upgrade $http_upgrade;
    proxy_set_header Connection "upgrade";
  }
}
You should, of course, adapt the server_name, ssl_certificate, and ssl_certificate_key values to your configuration.
Create a symbolic link (symlink) in order to activate the site:
$ sudo ln -s /etc/nginx/sites-available/sub.domain.conf /etc/nginx/sites-enabled/sub.domain.conf
Validate the configuration :
$ sudo nginx -t
Launch nginx:
$ sudo systemctl enable nginx --now
Or restart it if it’s already running:
$ sudo systemctl restart nginx
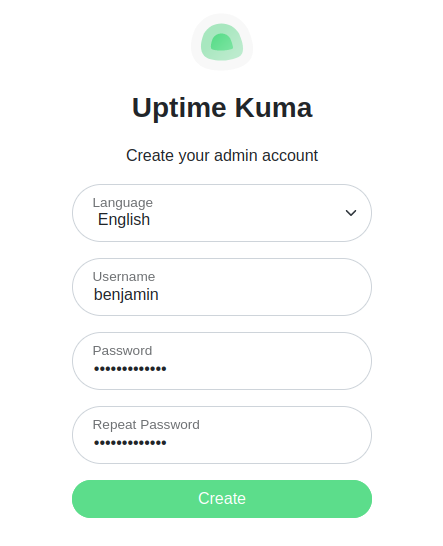
Your site will now be available at the address that you will have chosen for it. Navigate to this address: https://sub.domain.tld (replacing with your domain and TLD of course).
You will then set up your Uptime-kuma admin account, like in this screen capture:
What can you do with Uptime-kuma?
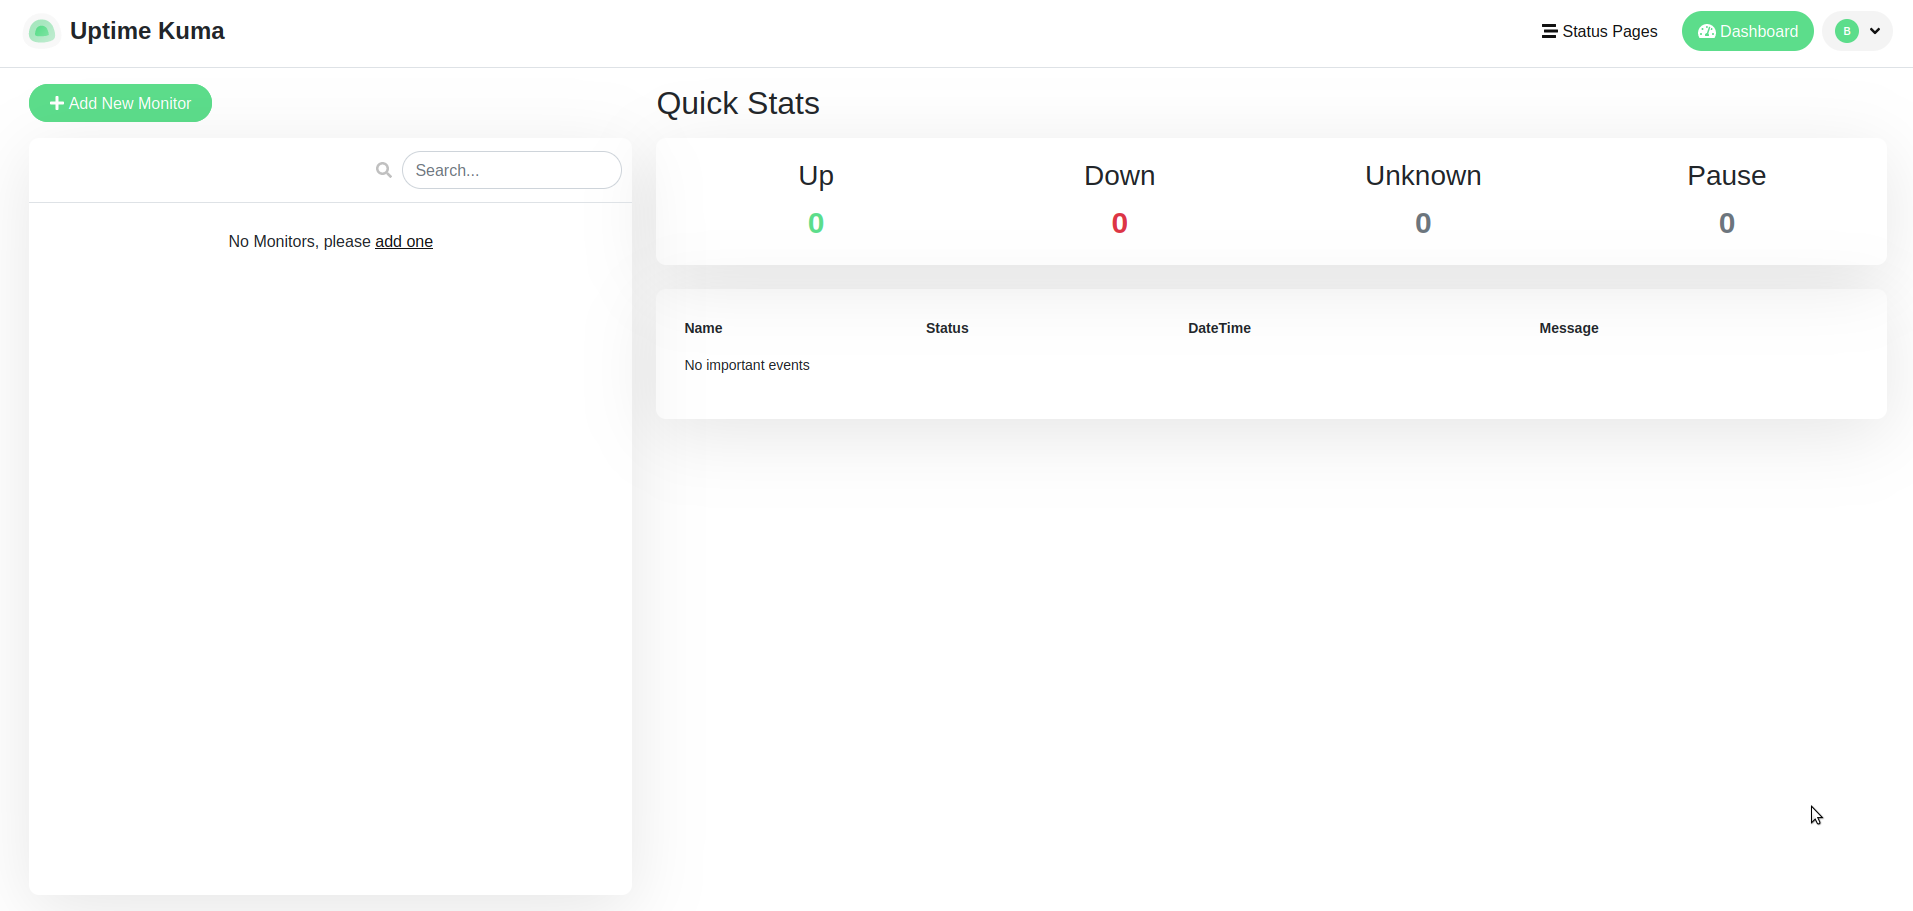
Once your account is created, you will be forwarded to an Uptime-kuma dashboard, for the moment empty.
You will then be able to add new HTTP(s), Ping, TCP, and other probes in order to monitor your various services and equipment, and you’ll see a screen like this one:
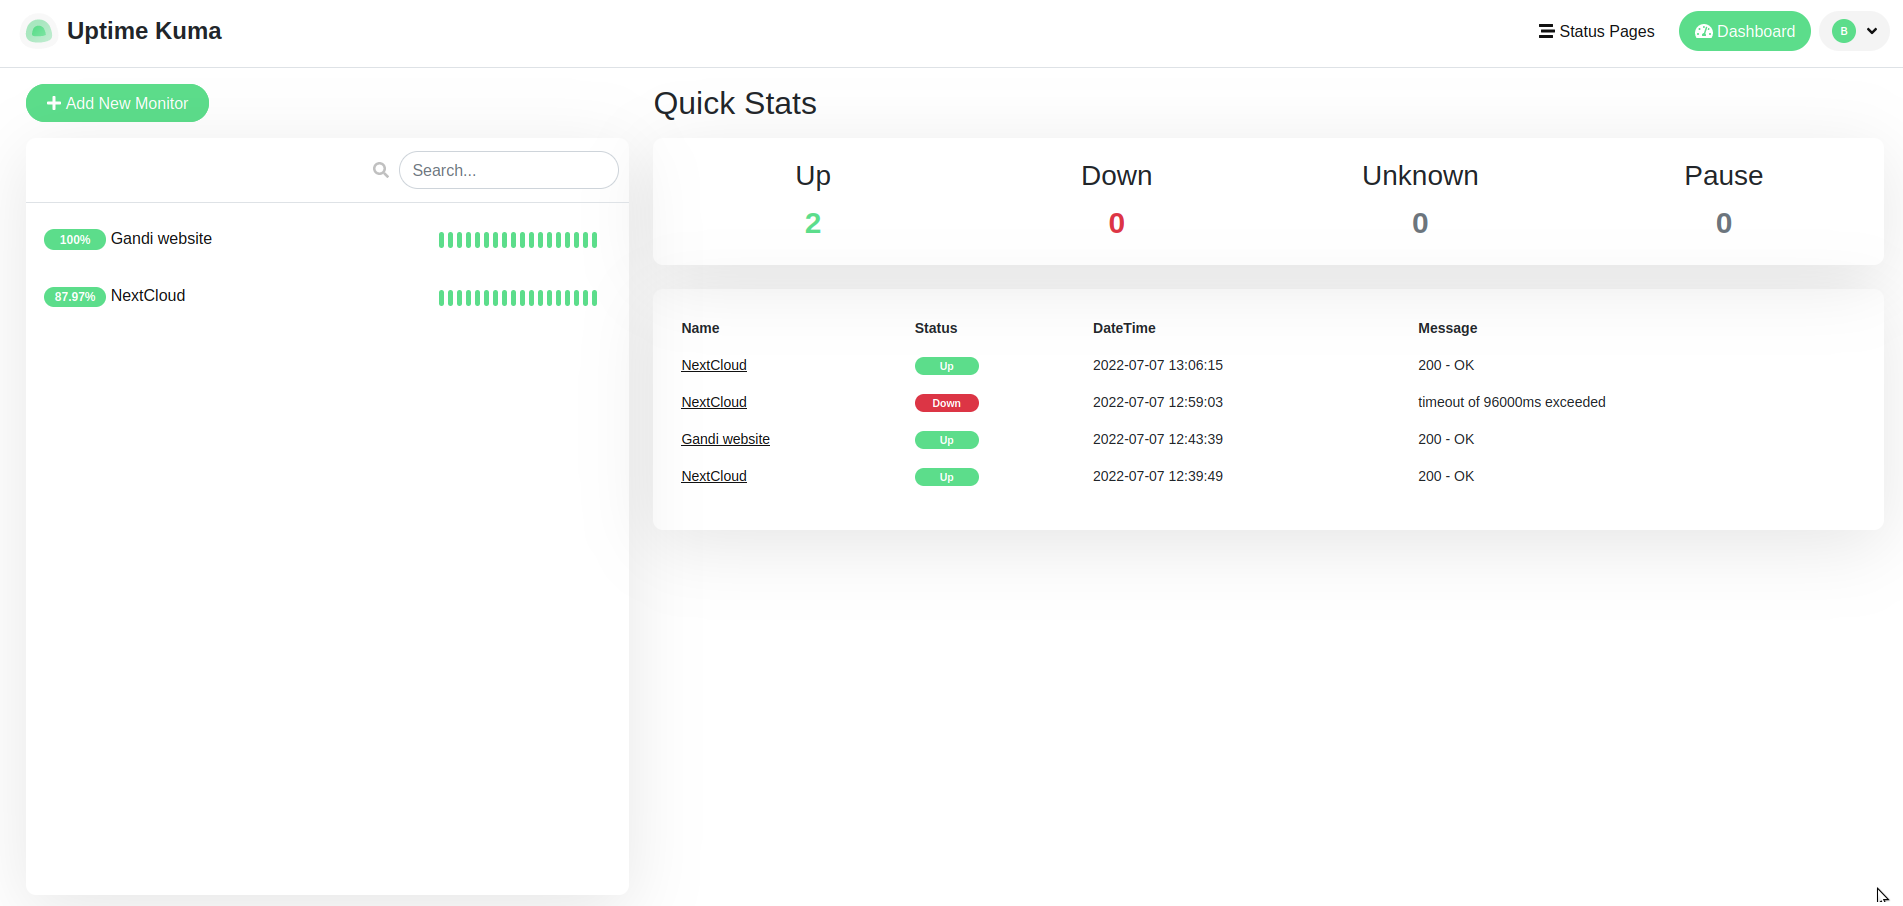
As you can see, you’ll have, at a glance, a history of the latest events.
This is just the base installation here—we haven’t optimized the security of the tool or of the web server.
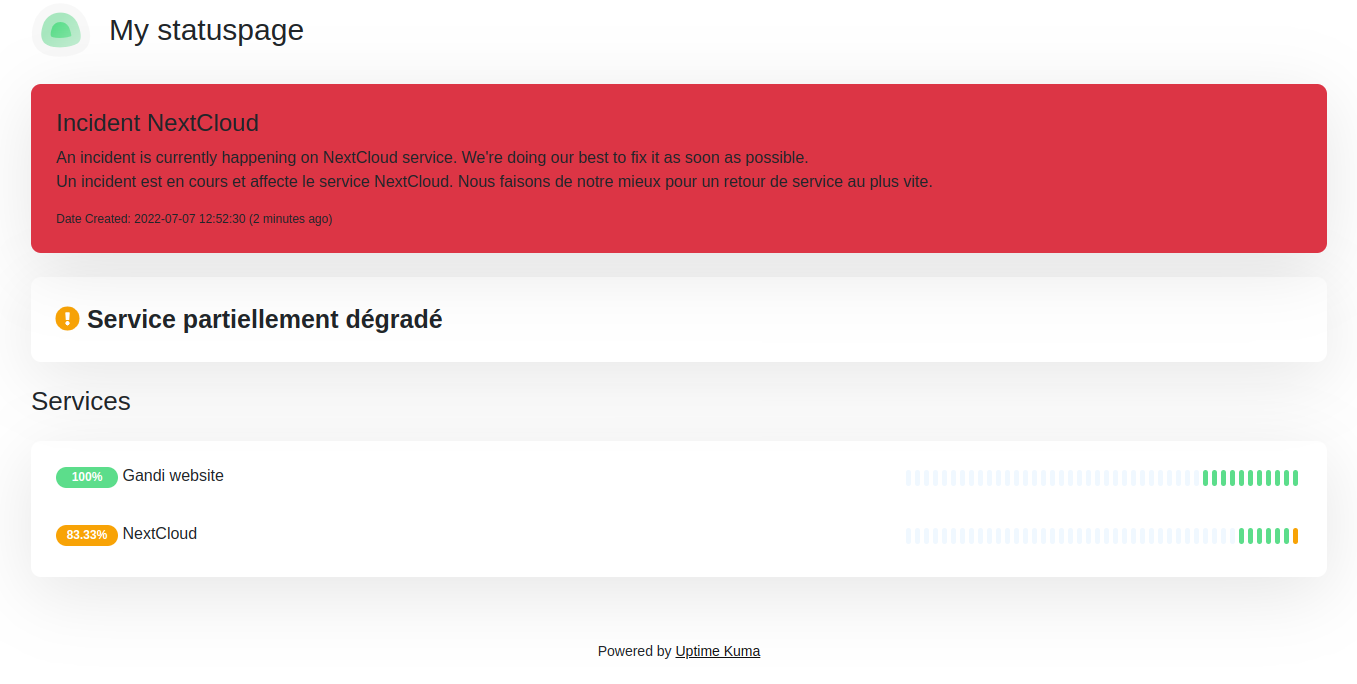
You will also be able to create a Status page that indicates the status of your services:
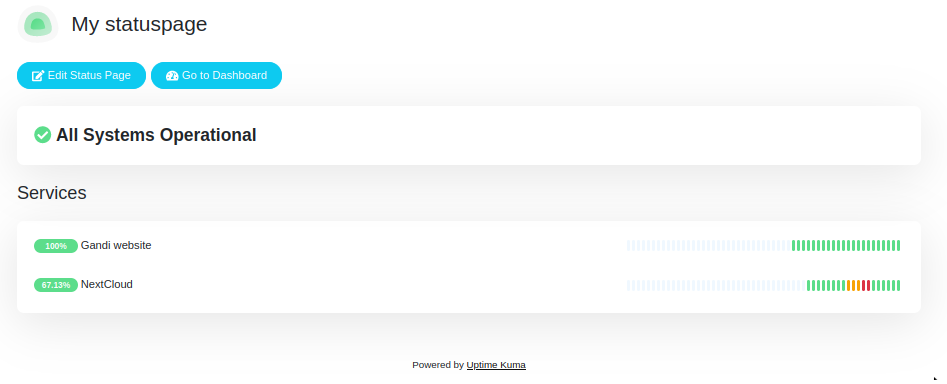
With the option to display an incident when necessary:
Finally, you will be able to define your settings for sending alerts via email, Telegram, Matrix, Push, and Mattermost, among others.
To check out all these settings, we recommend you to visit the Uptime-kuma wiki.


